In the reporting module, you can work with different filtering and grouping options. There are numerous combinations available for summing and grouping your data.

|
Important to know |
|---|---|
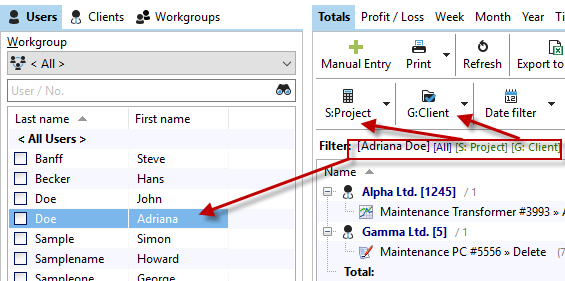
The Filter line displays the filters you set. In our example, you see all recorded times of the selected employee on the left side Adriana Doe, summed by project (S: Project) and grouped by customer (G: Client). Under the graphical buttons you will also see the selected options again (S: Project and G: Client). If you would like to set the filter above all employees, select "All employees" on the left side. |
|
|
With the Views button you can save the columns as well as the selected filter and grouping settings. So you can easily manage multiple list views and recall them at the touch of a button. |
|---|
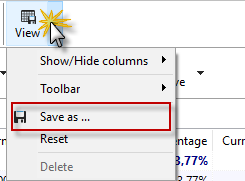
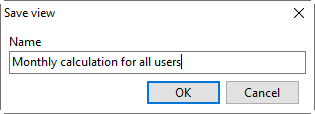
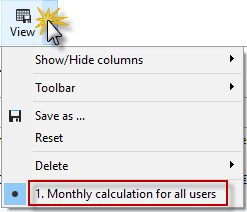
The tab "Clients" allows you to filter your projects for one, several or all clients. To select a client, tick the checkbox. Alternatively, you can use the search field to search for a client, set the check mark, and then empty the search box again. The previously set checkmarks for the other client are retained. This allows you to filter the desired clients from a long list.
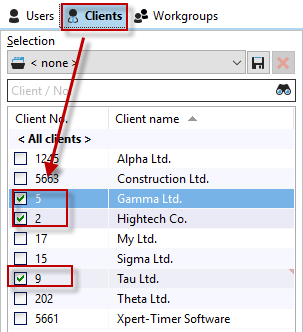
You can save these selected clients as a selection. Select some client, then click the "Save" button and give a meaningful name. Then your selection is available as a filter in the drop-down box.

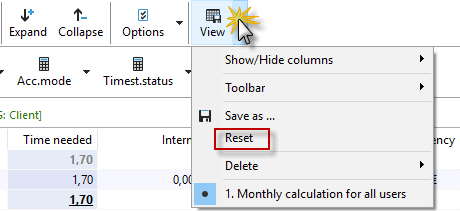
To reset filters and grouping settings, click on the "View" button and select the option "Reset".
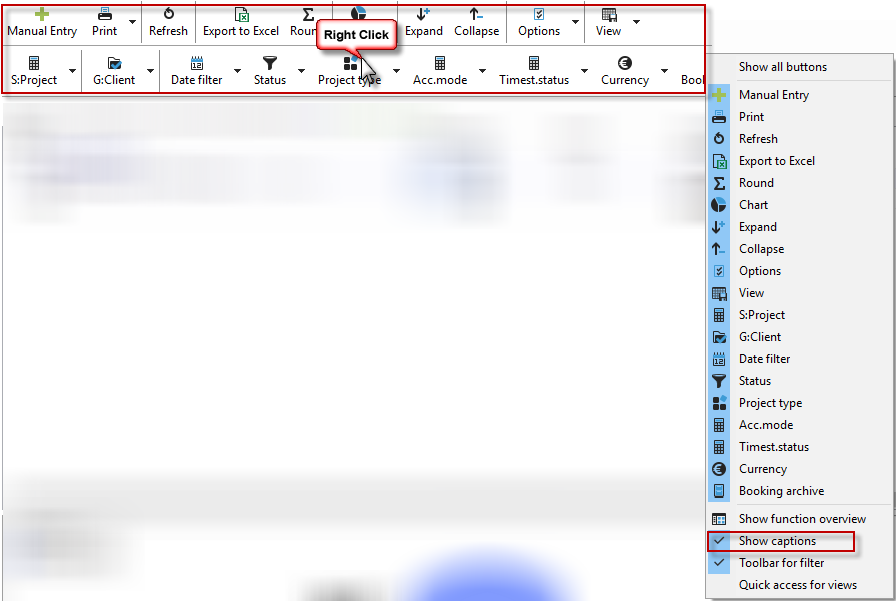
By right-clicking on the toolbar of your Reporting, you can combine the individual lines of the buttons into a single line. You can also show or hide the labels.
|
Hint |
|---|---|
Please also read the following chapters to get to know the reporting module. •Timestamps •Filters and grouping •Profit/loss •Weekly Report •Monthly Report •Yearly Report |
|