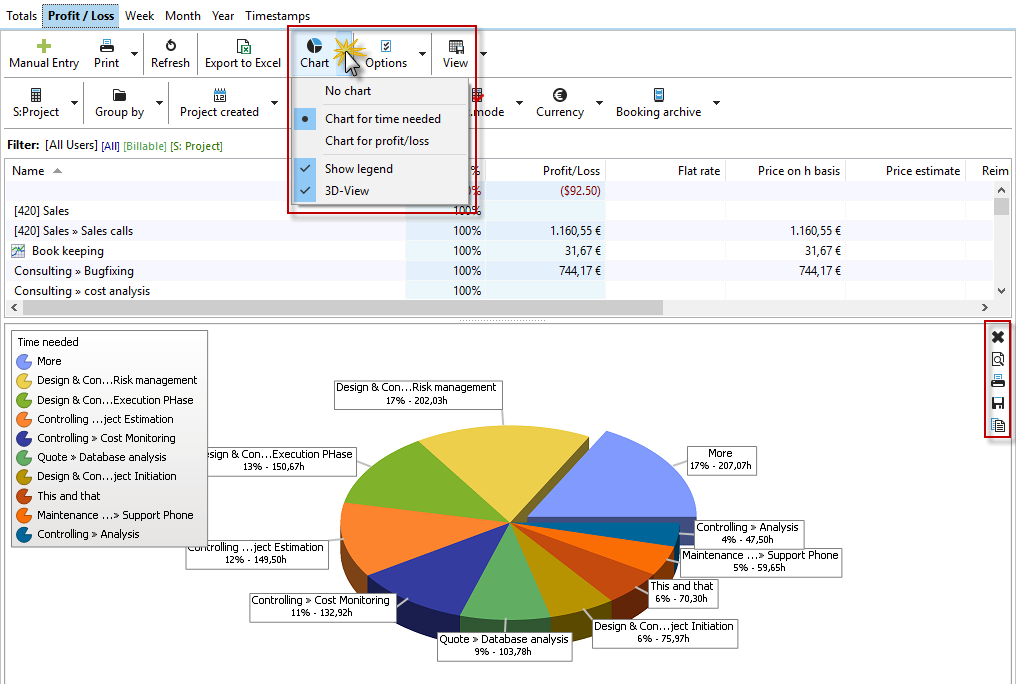
A profit/loss calculation is included in your Xpert-Timer.
The project costs (Flat rate, Price per hour) is set in the project settings in the tab "Billing". If you want to display the flat rate and the rate per hour in the report, please enter the hourly rate first and then the flat rate.

In the profit/loss tab you can see all project revenue and costs. Below you find a description of the fields.

Name |
The project name |
|---|---|
Profit in % |
Profit in percent on base of the incurring costs (reimbursables Win/Loss + user costs) |
Flat rate |
If a flat rate is set in the project settings, the flat rate is used for calculation. |
Price on h basis |
This is the price per hour set in the "Billing" tab in your project settings. |
Reimbursables |
The estimated price is calculated using the price per hour in the user settings or the price per hour in the project settings (whatever is chosen) and the "Time estimated" in the project settings. Formula: Time estimated * cost per hour = Estimated project total |
Project items |
If you have created reimbursables for your project, then those costs are deducted from the revenue. The result is set in the reimbursables profit/loss column. |
Person. costs |
The personal costs of the user are set in the user settings of Xpert-Timer. |
Time needed |
The time needed in a team. You should always include all users in your report, as it only makes sense to see how much time the whole project team spent compared to the revenue of the project. |
Time estimated |
You can add a time estimate for every project. This estimate is only for your visual control and to calculate the estimated project price. |
Time needed in % |
A graphical bar that shows how much time was spent compared to what was estimated for the project. |
The graphics you see underneath your report is always based on the grouping you set for your list. In our example we summarize by project, therefore the graphic displays the three projects.
